
How to Read Short Float % Properly Before Trading
The short float percentage is a widely used metric among traders, but it’s also one of the most misunderstood. Simply seeing “25% short float” isn’t enough—you need to know what it means, how it’s calculated, and how to use it to identify risk and opportunity before entering a trade.
What Is Short Float %?
Short float % refers to the percentage of a stock’s available float (shares publicly available for trading) that has been sold short. It is calculated using the formula:
Short Float % = (Short Interest ÷ Float) × 100
Example:
If a stock has 10 million shares in float, and 2.5 million are sold short:
Short Float % = (2.5M ÷ 10M) × 100 = 25%
How to Interpret Short Float % Levels
| Short Float % | Interpretation | Trading Signal |
|---|---|---|
| 0% – 5% | Very low bearish sentiment | Stable, low volatility |
| 5% – 15% | Moderate short interest | Watch for catalysts |
| 15% – 25% | High bearish bets | Possible squeeze conditions |
| 25%+ | Extremely high, crowding risk | High squeeze potential |
Key Questions to Ask When Reading Short Float
- What is the total float size?
High float stocks can absorb more shorts without much volatility. Low float stocks can’t. - Is the short float rising or falling?
A rising short float may indicate increasing bearish sentiment. A falling float might mean covering or reduced conviction. - What’s the volume like?
A high short float with high volume = potential breakout.
High short float with low volume = dangerous illiquidity. - Any upcoming catalysts?
Earnings, product launches, or upgrades can trigger major moves in heavily shorted stocks.
How to Use Short Float % in Your Trading Plan
- Swing Traders: Look for breakout setups in stocks with short float > 15%
- Day Traders: Use float %, volume, and news to predict intraday squeeze potential
- Long-Term Investors: Use it to gauge sentiment but not as a sole factor
Common Mistakes to Avoid
- Thinking high short float guarantees a squeeze
- Ignoring float size and daily volume
- Failing to check how current the data is (biweekly updates can lag behind real-time sentiment)
Where to Check Accurate Short Float Data
- Yahoo Finance – Under “Statistics”
- Finviz – In screener and quote page
- Fintel.io – Real-time estimates + official data
- Ortex – Best for daily tracking and squeeze scores
FAQs
What is a normal short float percentage?
Between 5% and 15% is typical for many stocks. Anything above 20% is considered high.
Can a stock rise even if it has high short float?
Yes. In fact, high short float can fuel rallies due to short covering.
Should I avoid trading stocks with high short float?
Not necessarily—but you should manage risk tightly and expect more volatility.
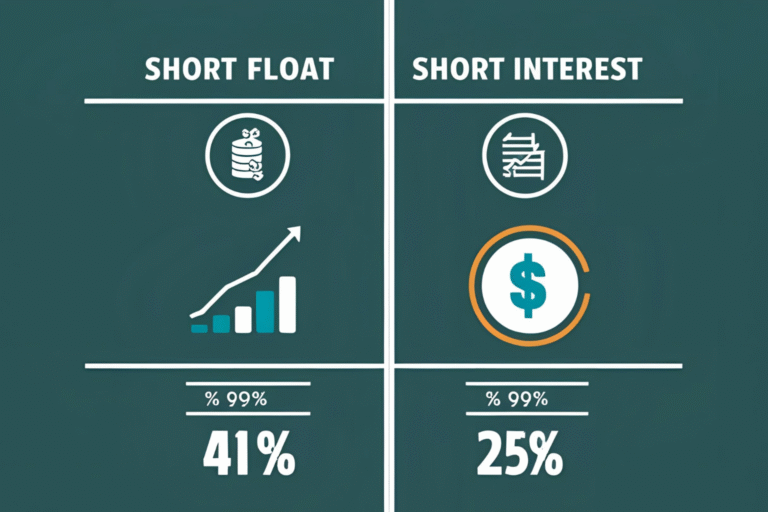
Is short float % the same as short interest?
No. Short interest is the raw number of shares sold short; short float % puts that in context relative to available shares.
How often is short float updated?
Official exchange data is updated twice monthly, but tools like Ortex and Fintel offer daily estimates.