How to Use Short Float in Technical Analysis
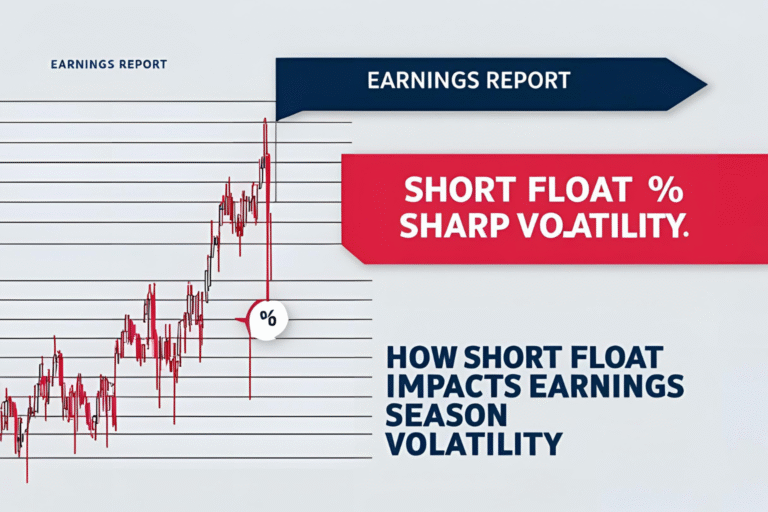
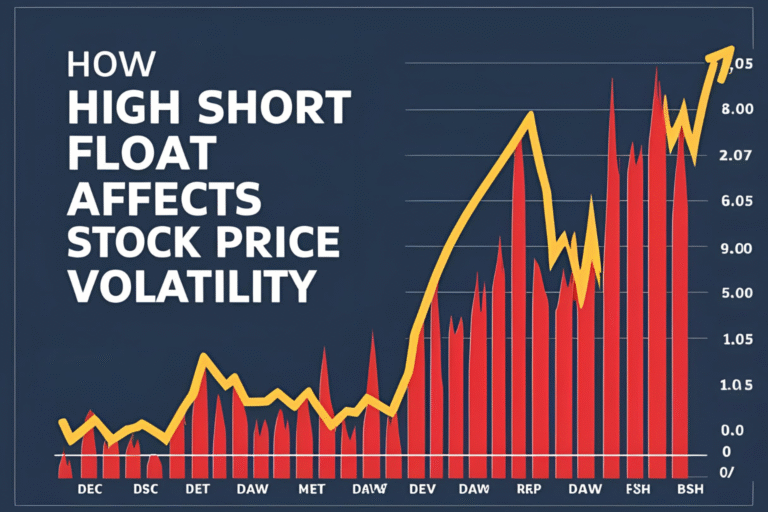
While technical analysis focuses on price charts, volume, and indicators, incorporating short float data can add a powerful layer of market insight. High short float levels often lead to unexpected price movements, especially when combined with technical breakouts. This guide explains how traders can use short float to enhance their technical analysis.
Why Combine Short Float with Technicals?
Short float helps identify trapped traders, especially during rallies. When technical indicators show bullish signals and a stock has a high short float, the probability of a short squeeze increases. This can lead to faster, more aggressive price action—ideal for active traders.
Key Technical Patterns That Work with High Short Float
1. Breakout Above Resistance
- If a stock breaks above a long-term resistance level with high short float, it can trigger short covering.
- Look for confirmation via volume spikes or bullish candlestick patterns.
2. Bullish Flag or Pennant
- Consolidation patterns near resistance in a high short float stock can signal continuation moves once breakout occurs.
3. Cup and Handle Pattern
- When paired with high short float, this pattern can lead to explosive upside moves.
Volume: The Confirmation Factor
Volume is critical when analyzing short float setups:
- Low volume = weak breakout (shorts stay confident)
- High volume = panic buying from shorts and new buyers
Use volume indicators like:
- Volume Oscillator
- On Balance Volume (OBV)
- Accumulation/Distribution Line
Best Indicators to Use with Short Float
| Indicator | Why It Works with Short Float |
|---|---|
| RSI | Identifies oversold conditions before a squeeze |
| MACD | Confirms momentum shifts during short covering |
| VWAP | Acts as a key support/resistance during intraday squeezes |
| Moving Averages | Help track breakout points and reversals |
Real-World Example: Applying Short Float to Charts
Let’s say stock XYZ has:
- Short Float: 38%
- Daily Chart Pattern: Bullish flag
- Volume Surge: 3× average volume on breakout
This combination suggests a high probability of a short squeeze. If RSI and MACD align bullishly, it strengthens your trade setup.
Risk Management Tips
- Use tight stop-loss orders in high float scenarios
- Don’t chase breakouts—wait for retests or intraday confirmation
- Size trades properly—volatility is much higher than average stocks
FAQs
Is technical analysis enough for short float stocks?
Not always. Combining technical analysis with short float data provides a more complete edge, especially in volatile environments.
Can short float override bearish chart setups?
Sometimes. Even bearish charts can reverse if a surprise catalyst triggers short covering.
What’s the best chart timeframe for analyzing short float setups?
Use daily charts for swing trades and 5- or 15-minute charts for intraday squeezes.
Should I enter trades solely based on short float?
No. Always combine float data with technical indicators and chart structure for confirmation.
Do short float levels change intraday?
Not usually. Short float is based on periodic reporting, but you can track borrow rates and short volume intraday on platforms like Ortex or Fintel.


