What Is Short Float? Meaning, Importance & Trading Impact
In the world of stock trading, especially among short-sellers and active traders, one term that often surfaces is short float. It’s a critical metric used to measure market sentiment and identify potential volatility. Understanding what short float is and how it affects stock movement can give you a significant edge in your trading decisions.
What Is Short Float?
Short float represents the percentage of a company’s publicly traded shares that have been sold short but haven’t yet been covered or closed out. In other words, it’s a snapshot of how much of the float (available shares for trading) is currently borrowed and bet against.
For example, if a stock has 100 million shares in its float and 10 million are shorted, the short float is 10%.
Why Is Short Float Important?
Short float provides insight into market sentiment—whether traders are generally bullish or bearish on a stock. Here’s why it matters:
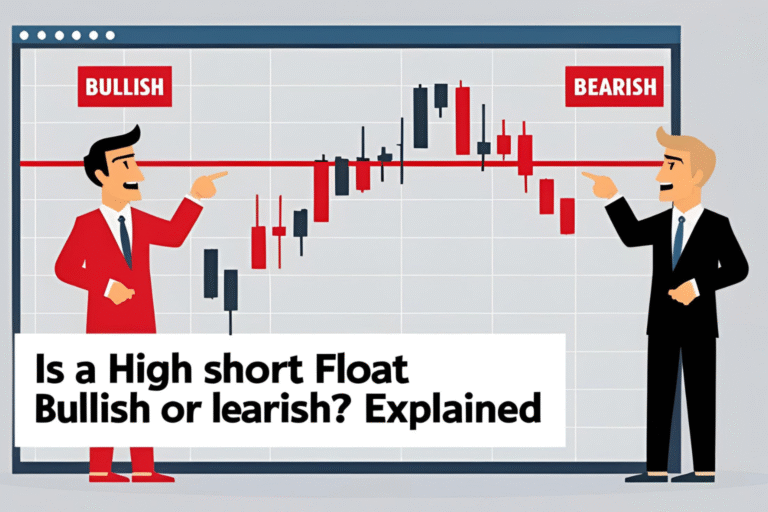
- Market Sentiment Indicator: A high short float indicates many investors believe the stock will decline.
- Volatility Signal: Stocks with high short float can be more volatile, especially if bullish news triggers a short squeeze.
- Risk Management: It helps traders assess the risk of entering a position—especially before earnings or major news.
How Short Float Affects Trading
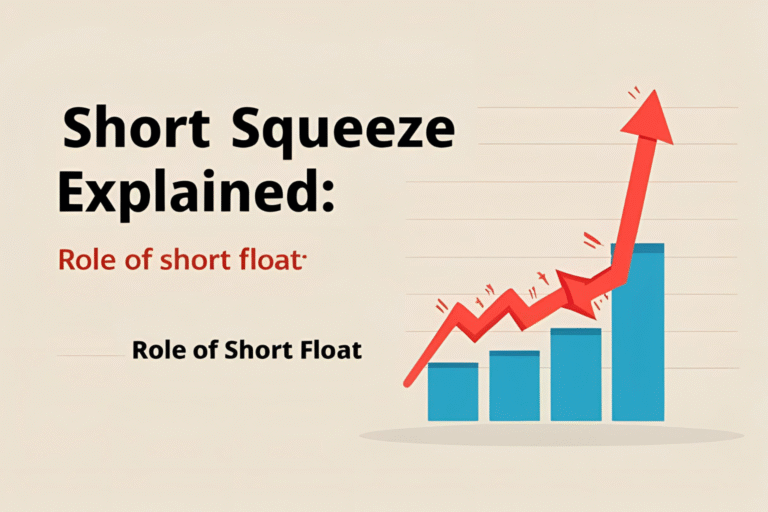
- Short Squeeze Potential
When a heavily shorted stock begins to rise, short-sellers may rush to cover their positions, causing a rapid price increase—a short squeeze. High short float stocks are prime candidates for this. - Trading Volume Analysis
Comparing short float with average trading volume helps traders identify unusual activity. If short float is rising along with volume, bearish pressure may be building. - Earnings Volatility
Stocks with high short float often react sharply during earnings seasons as traders bet on surprises or reversals.
How to Check Short Float
You can find short float data on most financial platforms:
- Yahoo Finance: Look under “Statistics” for short float %.
- FINRA: Offers short interest data that contributes to short float.
- MarketWatch, Benzinga, and TradingView: Also provide updated short float metrics.
What Is a “High” Short Float?
There’s no absolute benchmark, but here’s a general idea:
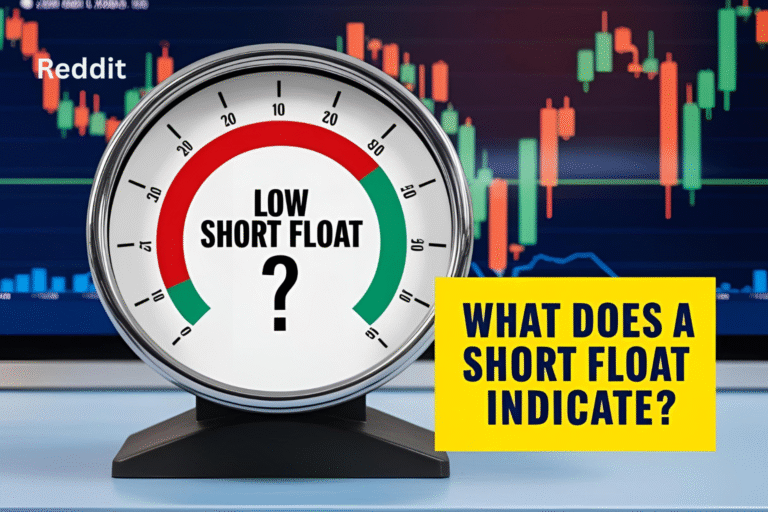
- Below 5%: Low short interest—generally bullish sentiment
- 5%–15%: Moderate short interest
- Above 20%: High short interest—may signal bearish sentiment or short squeeze potential
FAQs
What is considered a high short float?
A short float above 20% is generally considered high and may indicate the potential for a short squeeze.
How often is short float updated?
Most data providers update short float every two weeks, though some platforms may show estimates based on recent activity.
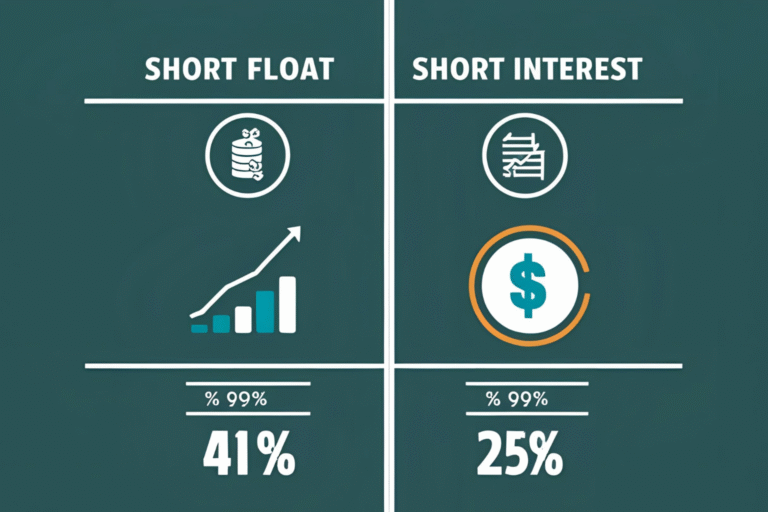
Is short float the same as short interest?
Not exactly. Short interest is the total number of shares shorted, while short float is the percentage of the float that’s shorted.
Why do traders watch short float before earnings?
High short float can signal potential volatility around earnings reports, especially if expectations are low and results beat forecasts.
Can ETFs have short float?
Yes, although it’s less common. Short float in ETFs can indicate bearish sentiment on the sector or index they track.